Ng Wee Chai
Data Analyst | Data Scientist

I’m a results-driven Data Analyst and aspiring Data Scientist, transitioning from architecture into business intelligence. I use Python, SQL, Power BI, and machine learning to extract insights and build dashboards that drive strategic decisions. My work focuses on sales forecasting, HR analytics, and customer segmentation, with a passion for solving real-world business problems through data. I’m committed to continuous learning and growth, actively pursuing advanced certifications to deepen my impact in the data science field.
Contact Me:
+65 9733 1257
weechai88@gmail.com
Professional Projects
Project 01: Cafe Sales Dashboard & Insights
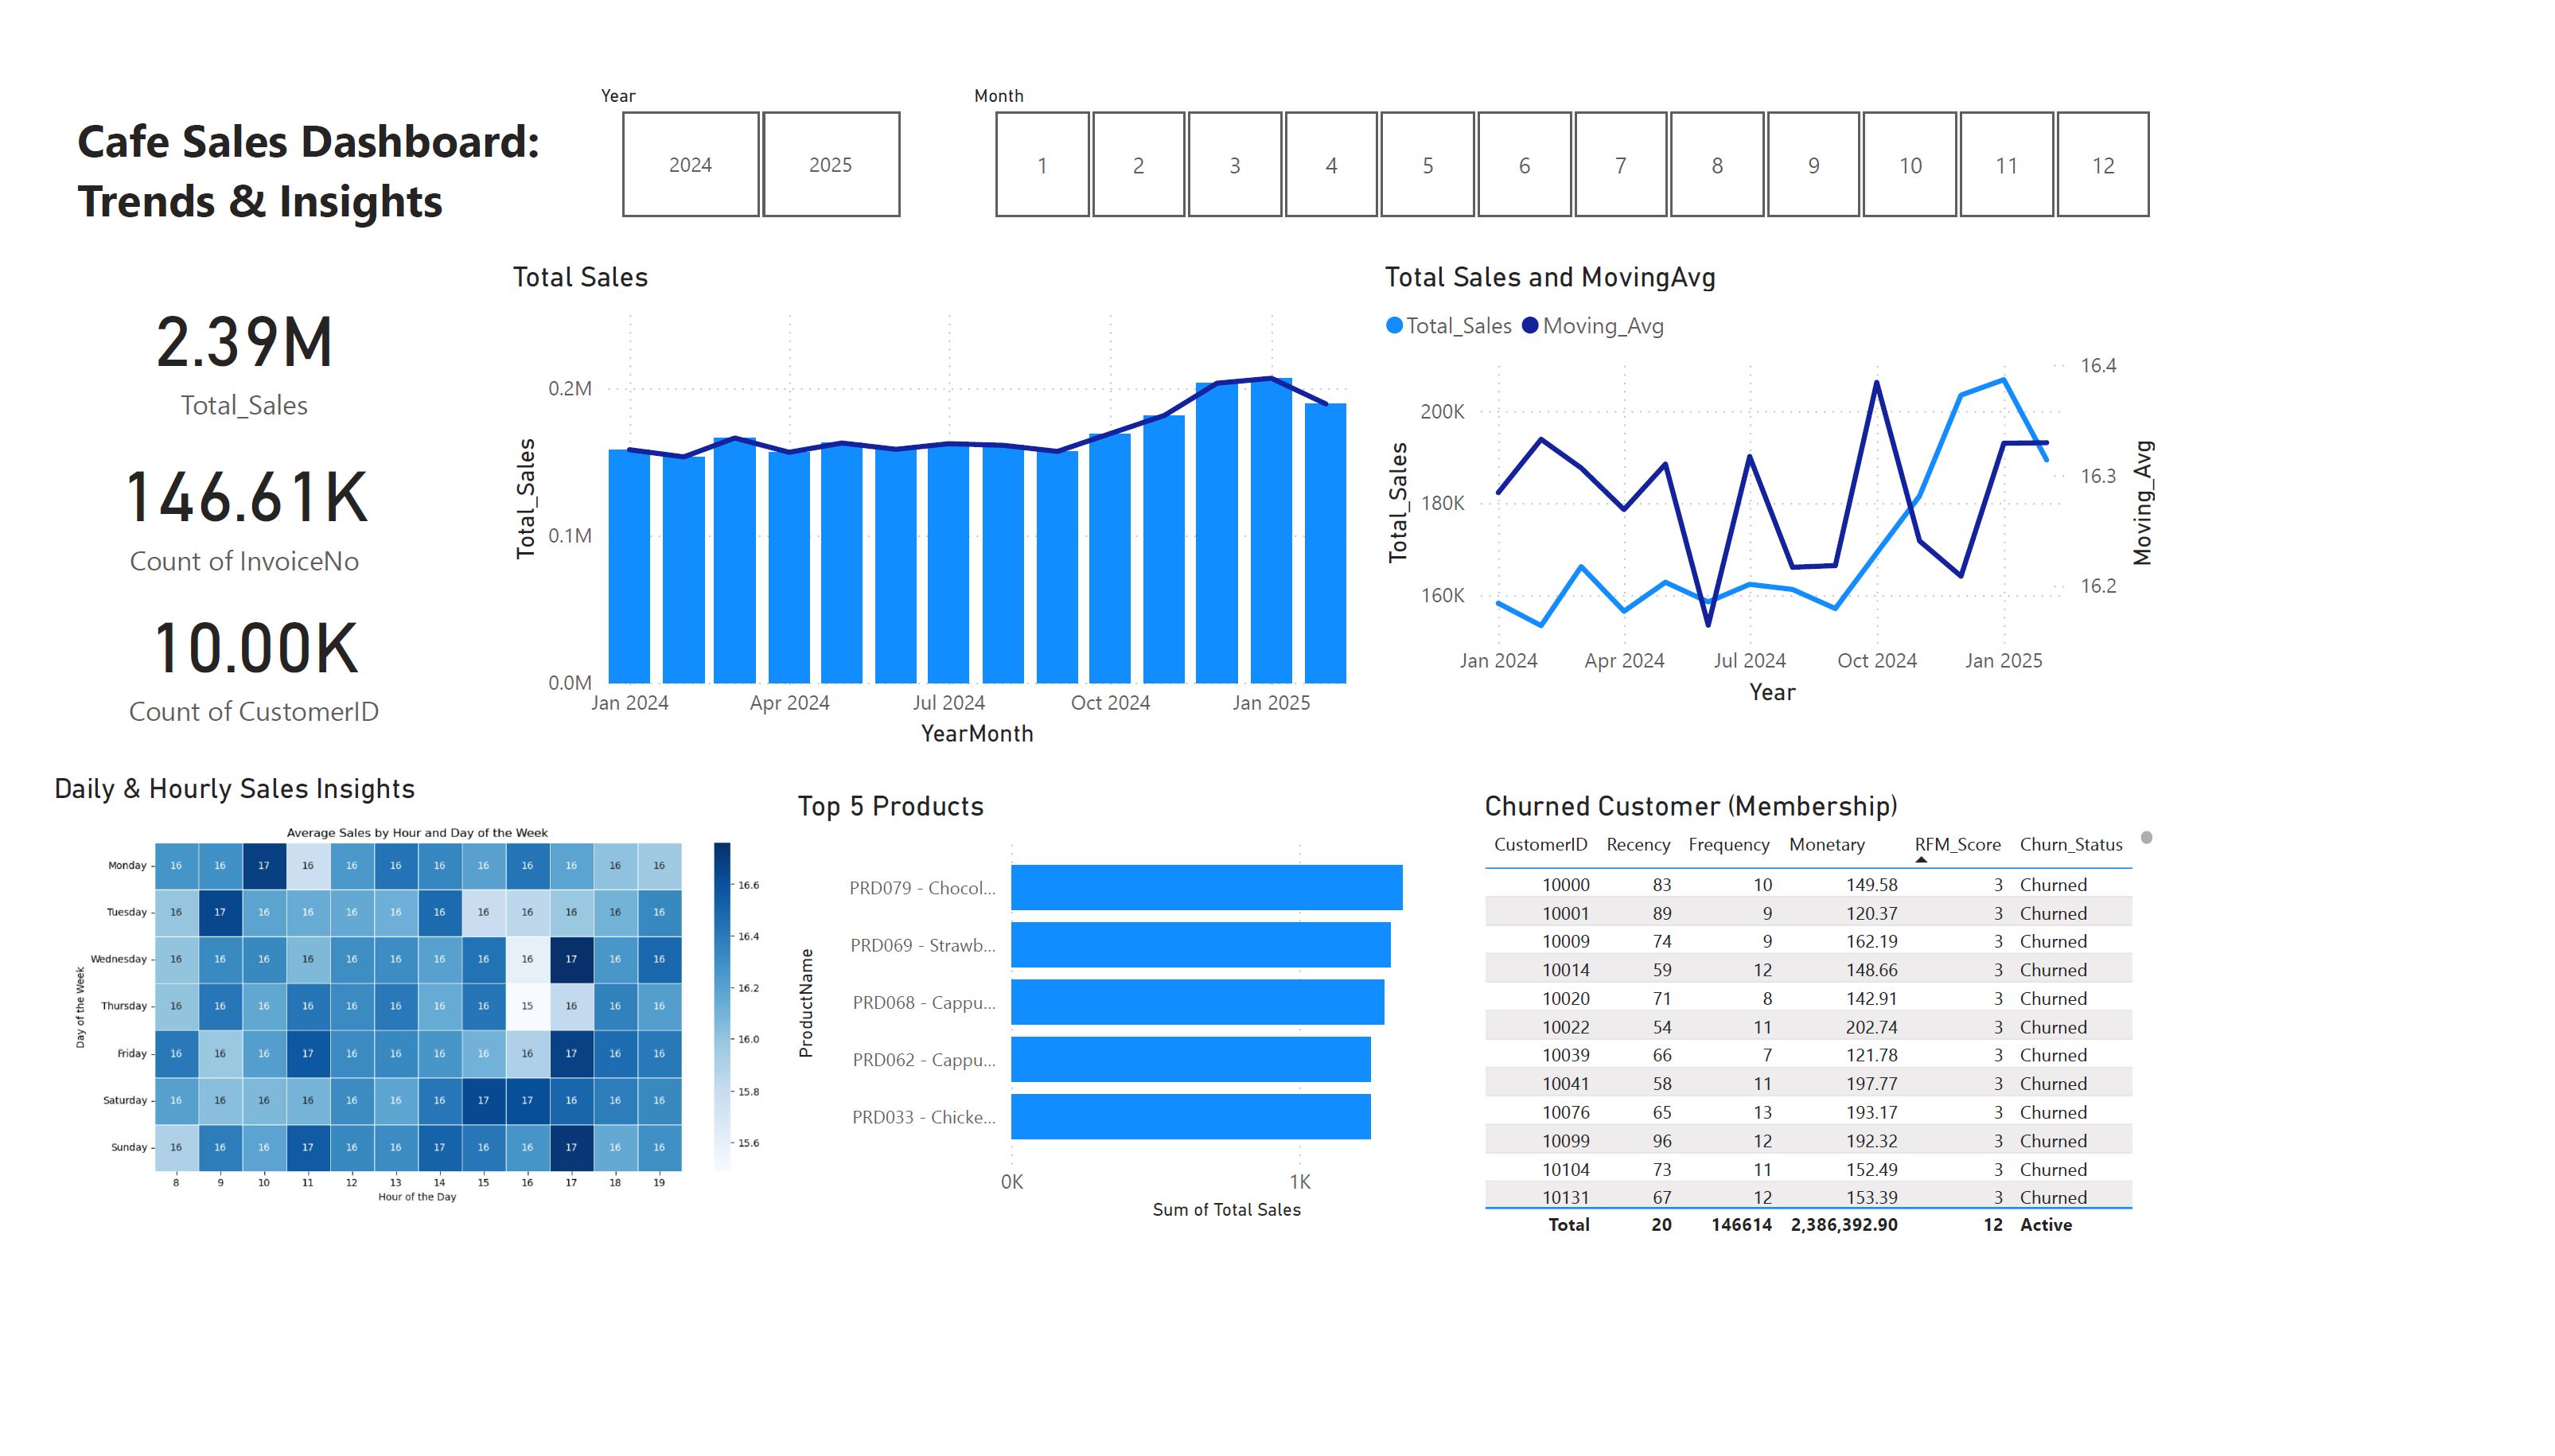
This dashboard was built for a cafe business to uncover sales performance trends, customer behavior, and operational opportunities. Developed during a freelance project (with anonymized data), it enables stakeholders to monitor key metrics, optimize strategies, and make data-driven decisions with confidence.
- Cleaned and transformed raw sales data using Python, including feature engineering (e.g., TotalPrice).
- Segmented customers with RFM analysis to identify loyal and churned groups for targeted campaigns.
- Built a heatmap to visualize hourly sales patterns and recommend staffing adjustments.
- Highlighted revenue trends, top-selling products, and customer loyalty behavior.
- Tracked performance with dynamic KPIs, including a 20.26% sales increase from Oct to Dec 2024.
- Tools Used: Power BI, DAX, Python (pandas), Excel
Project 02: E-Commerce Sales Analysis
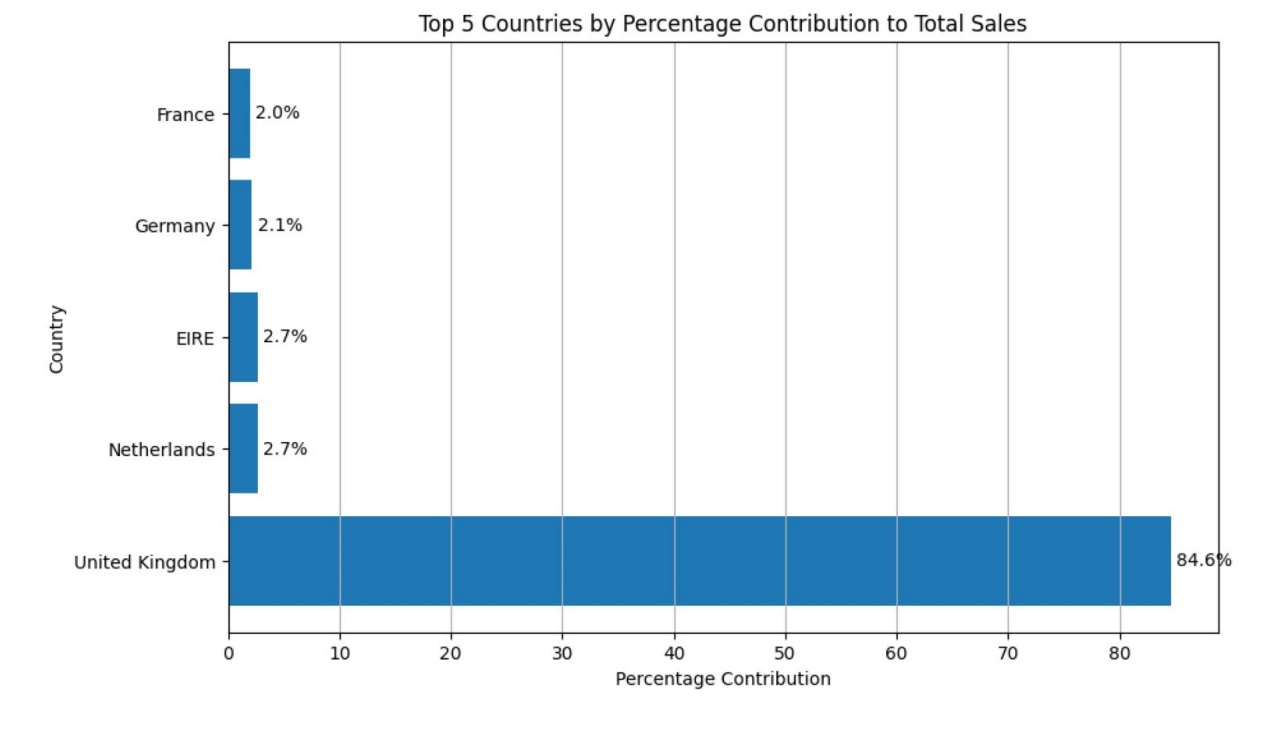
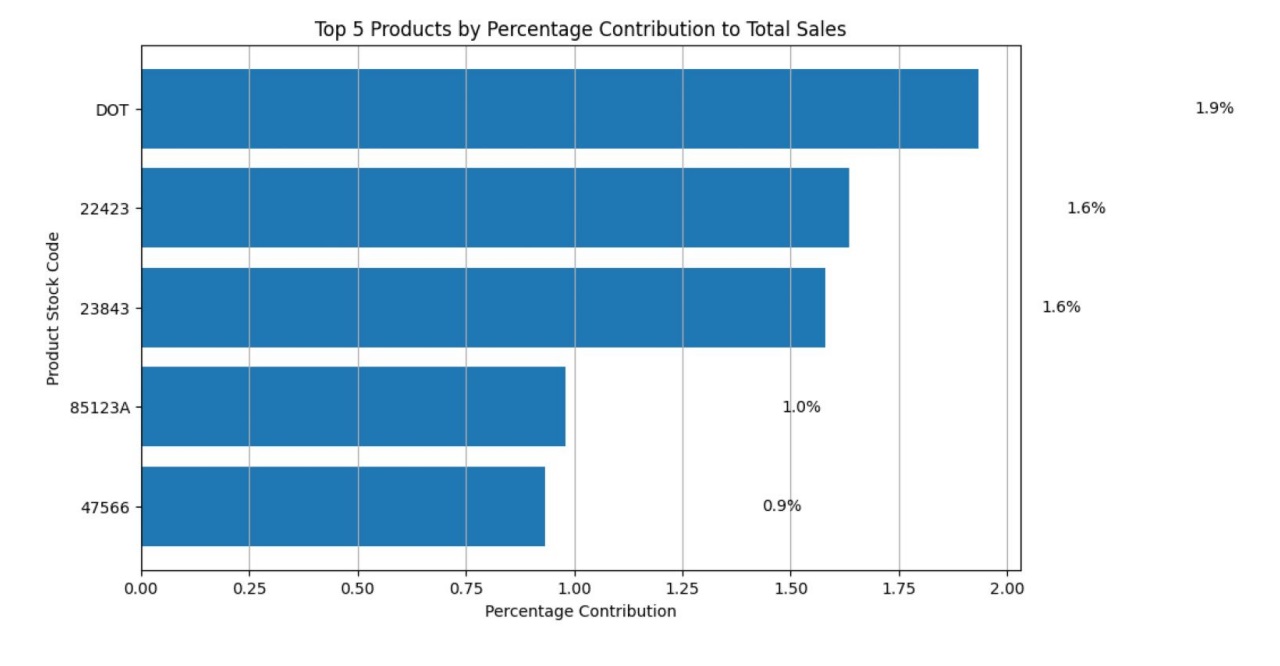
This Python-driven exploratory data analysis project investigates sales trends and customer behavior for an e-commerce retailer. It was designed to demonstrate how raw transaction data can be transformed into meaningful business insights using only Python libraries, without relying on external BI tools.
- Processed over 500,000 transaction rows using pandas, with cleaning, aggregation, and feature engineering.
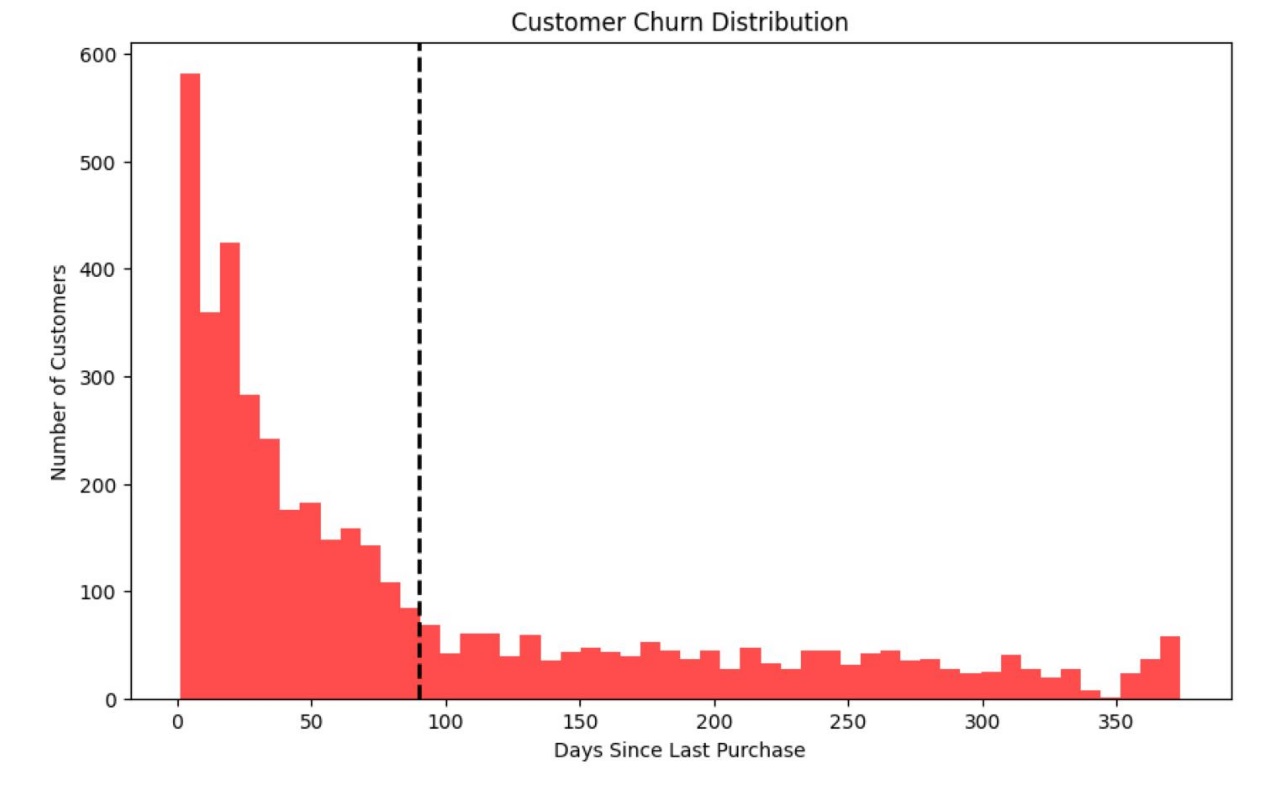
- Performed RFM analysis and custom churn logic to identify inactive customers.
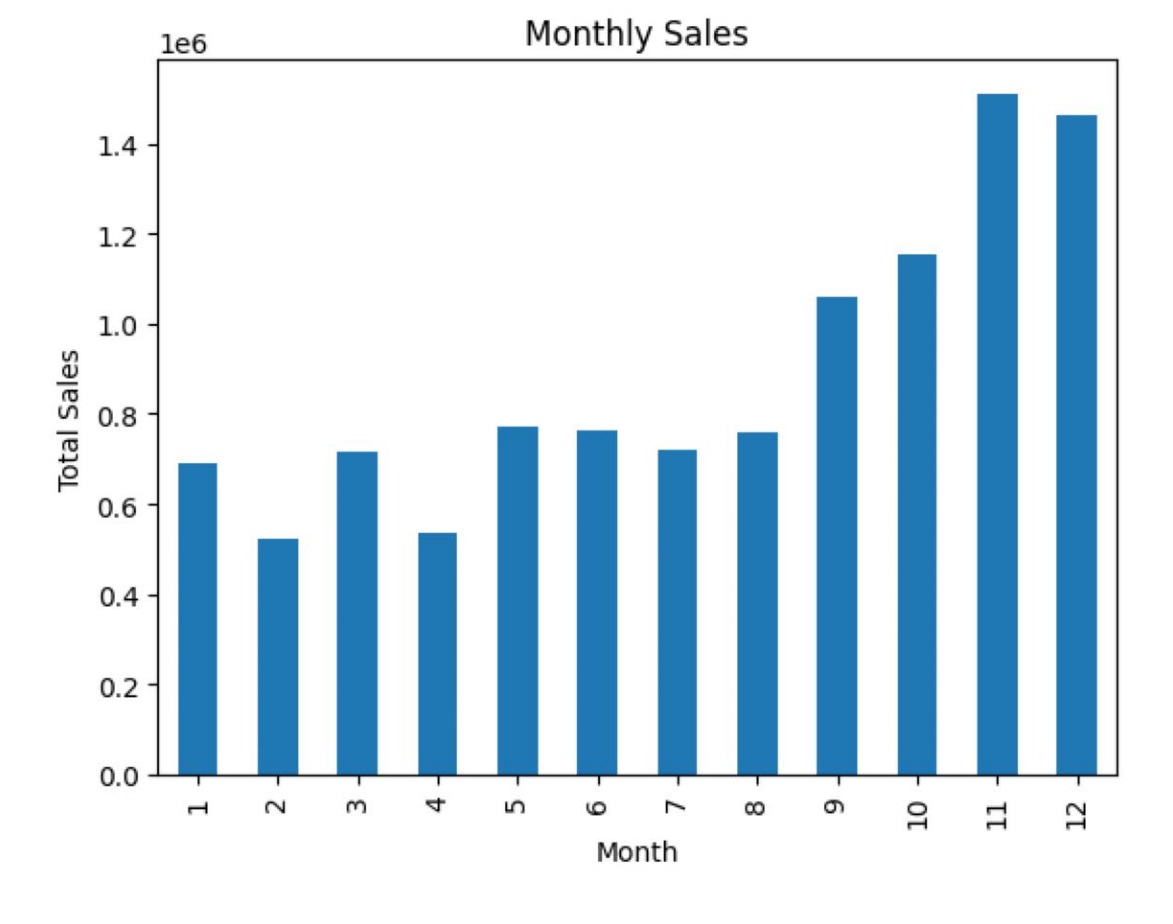
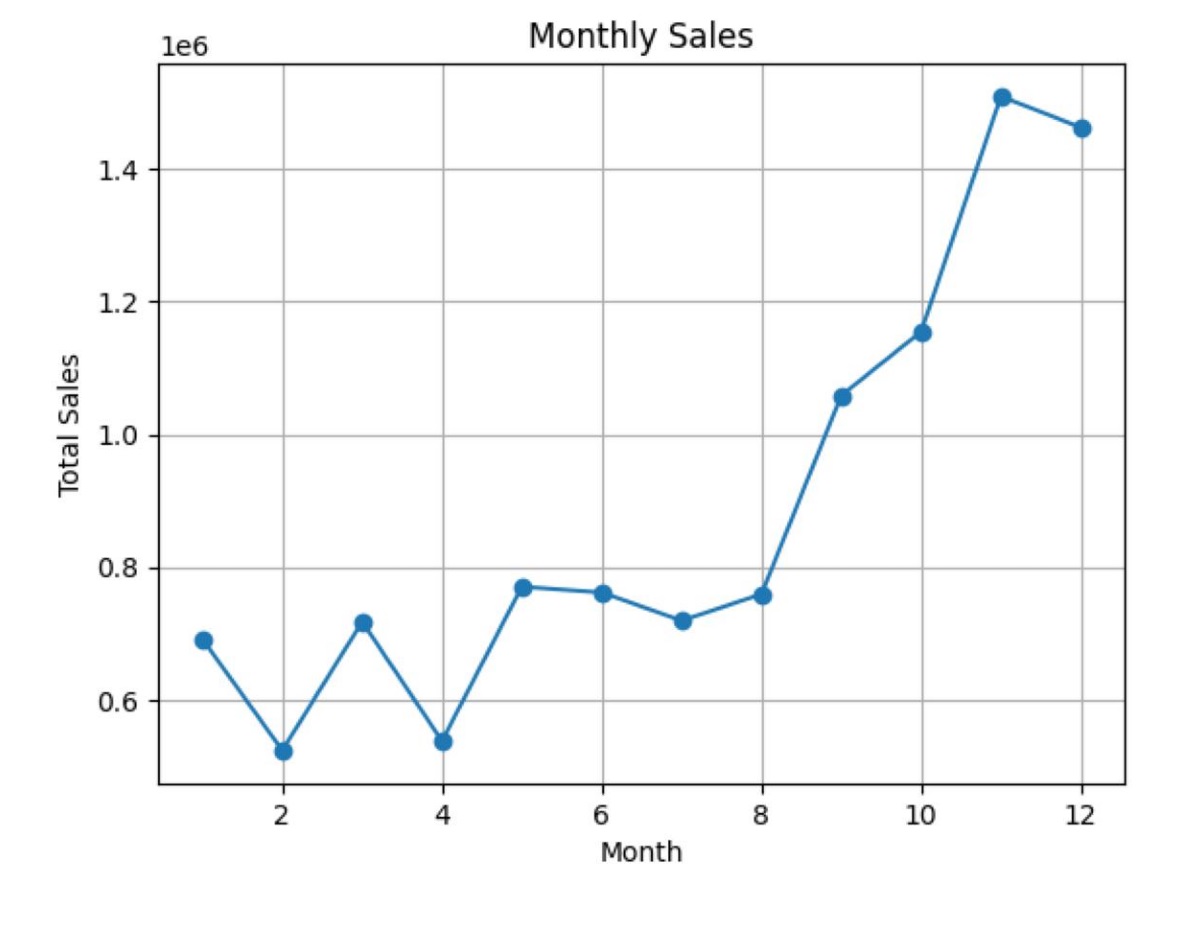
- Visualized monthly sales trends using bar and line charts for seasonality analysis.
- Ranked top 5 products and top countries by total revenue using horizontal bar charts.
- Plotted churned customer distribution using Seaborn histograms.
- Tools Used:Python, pandas, Matplotlib, Seaborn, Jupyter Notebook
Project 03: HR Analytics for Interior Design
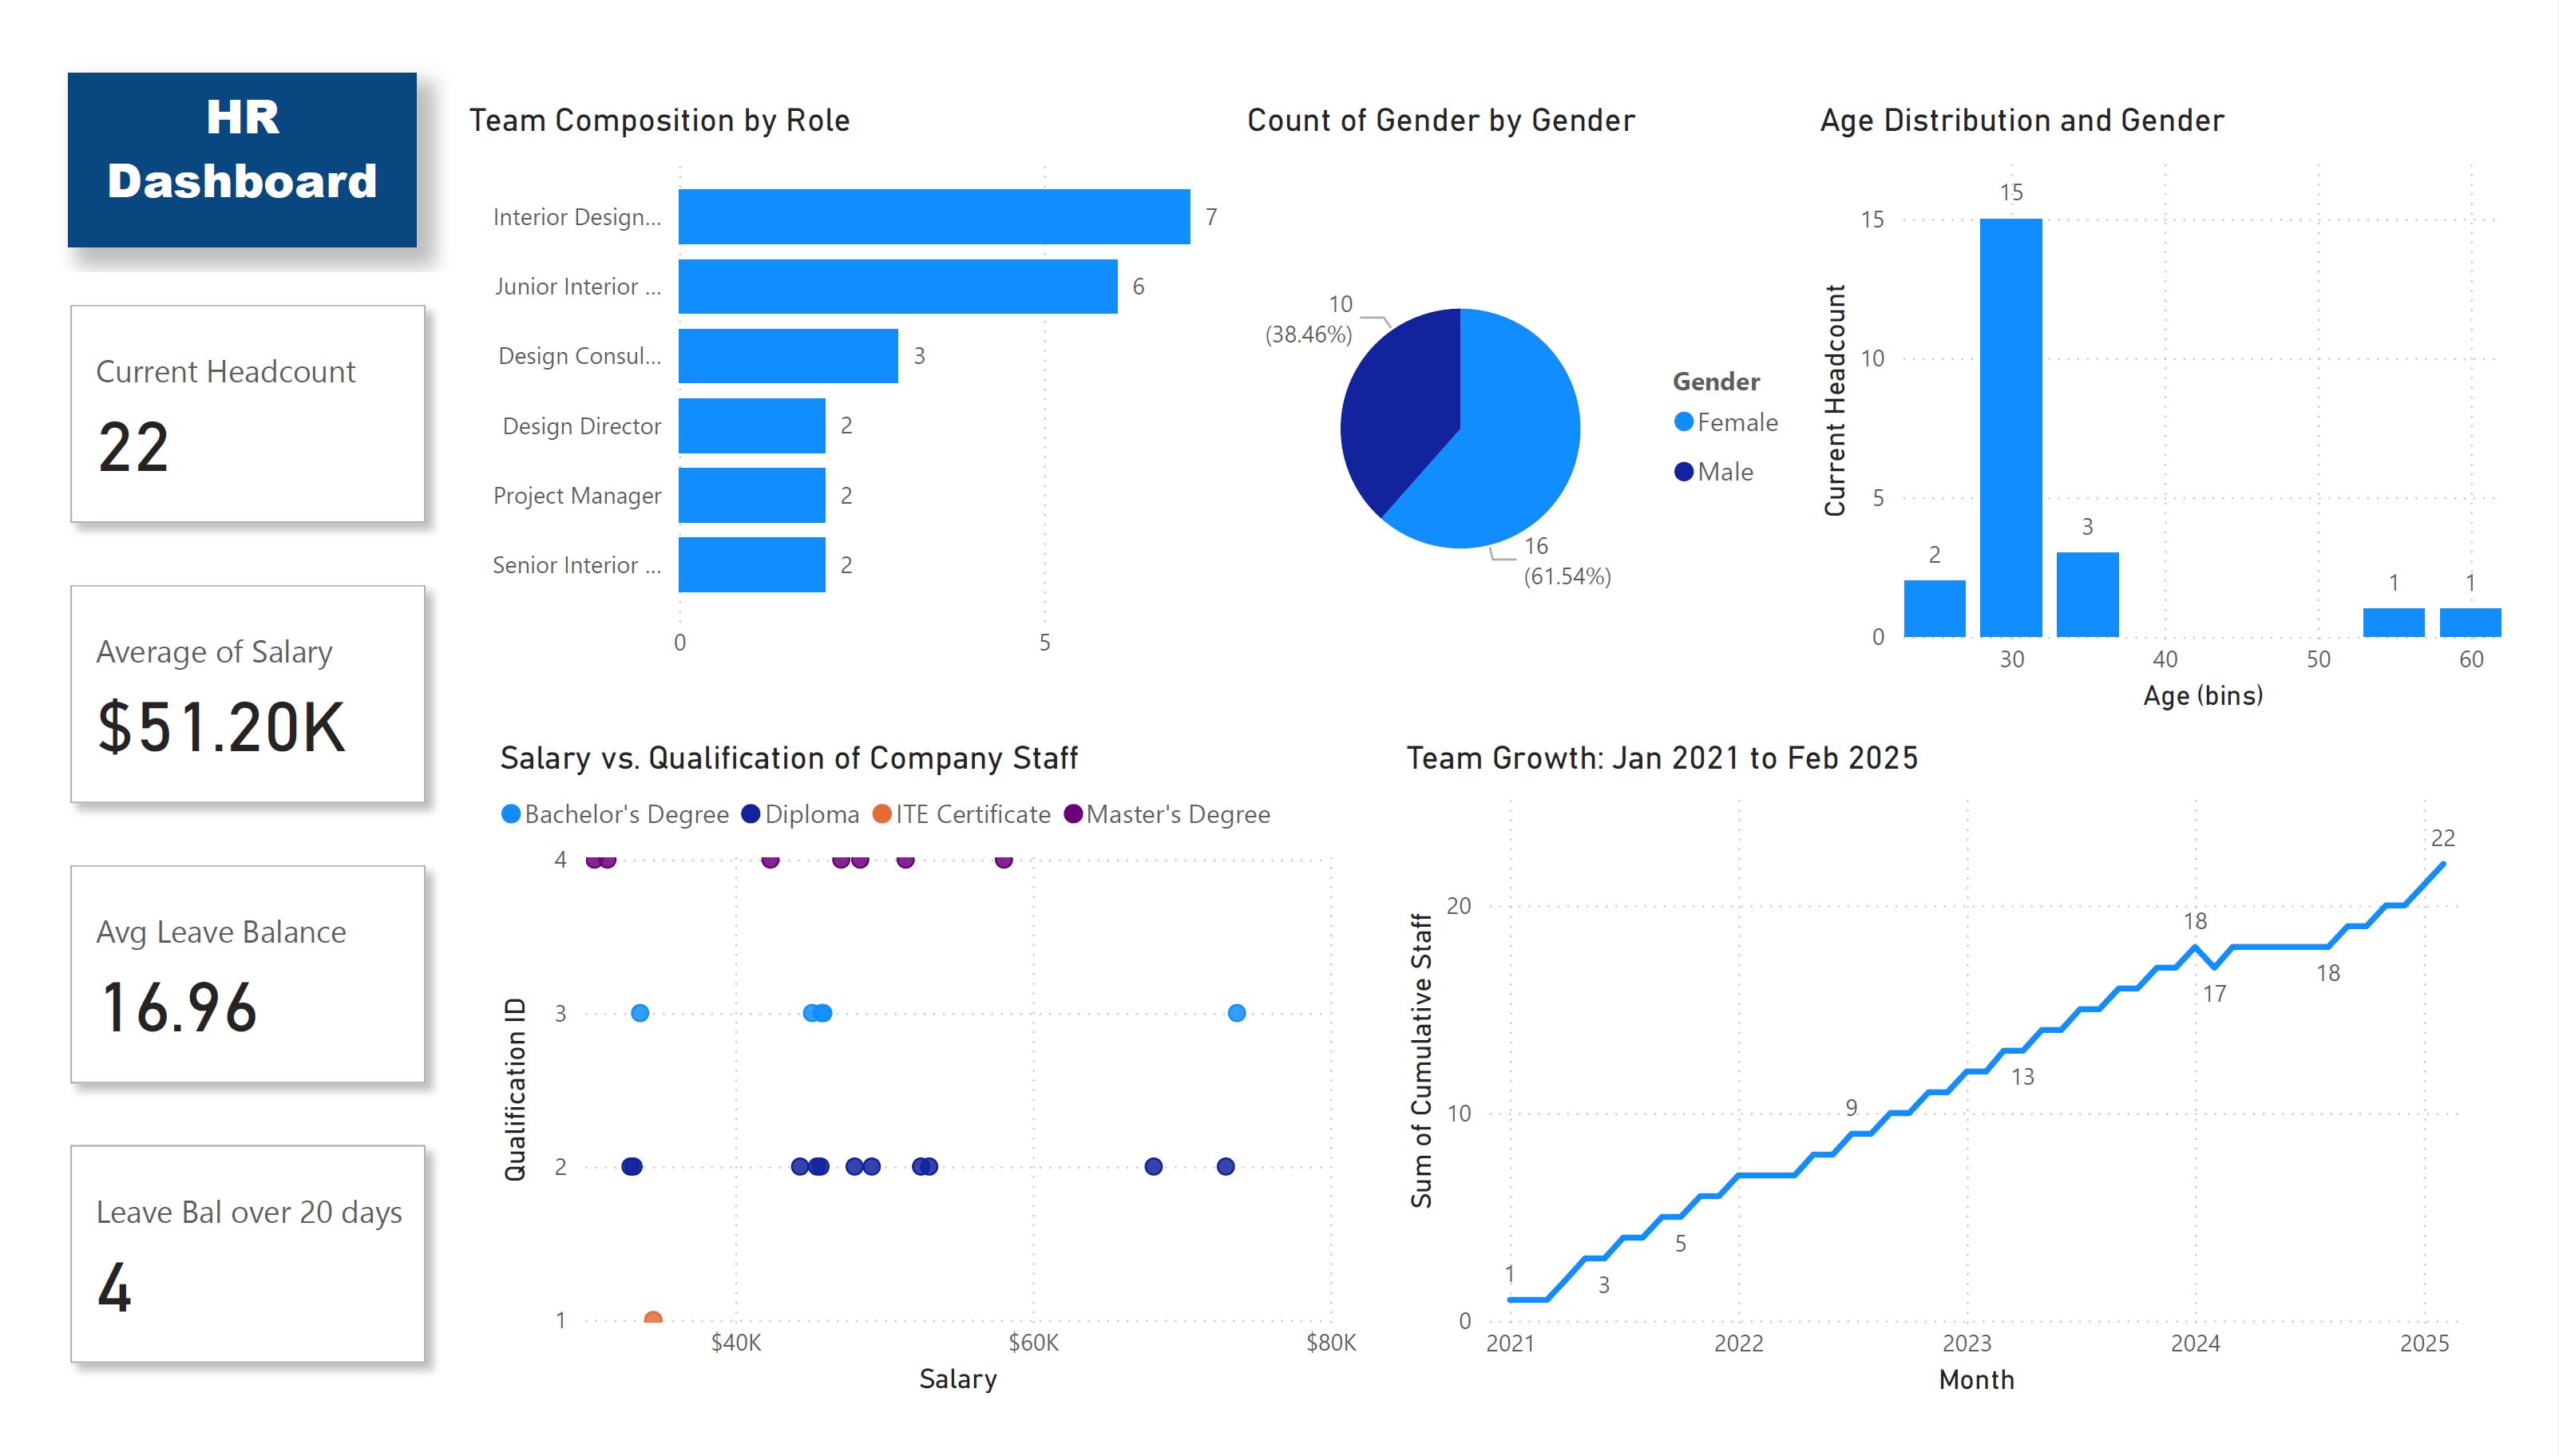
This Power BI dashboard was developed for a small interior design firm to visualize and monitor key HR metrics across a multi-year period (2021–2025). The goal was to provide stakeholders with a centralized view of workforce composition, employee well-being, and organizational growth, all while supporting HR decisions around staffing and budgeting. Due to confidentiality, the dataset has been modified while retaining real-world structure and logic.
- Created interactive KPI cards to track headcount, salary averages, and leave balances.
- Designed charts for team composition, gender and age distribution, and role hierarchy.
- Incorporated attrition analysis and historical staff growth trends.
- Highlighted key metrics like employees with high leave balances and salary-to-qualification correlation.
- Tools Used: Excel (data preparation), Power BI (DAX, visuals, and dashboard design)
Personal Projects
Project 1: Backpacker Travel Planning App
- Designed an AI-powered chatbot that personalizes travel experiences for backpackers visiting Singapore.
- Features:
- Integration with Google Sheets for real-time itinerary planning.
- Enhanced user interaction through OpenAI API for natural language processing.
- Seamless navigation with Google Maps API for visualizing itineraries and locations.
- Supports both solo and group planning, catering to various travel styles.
- Tools & Technologies:
- Python: Machine learning model to improve response accuracy by leveraging RAGAS score analysis.
- OpenAI API: For dynamic and conversational user interactions.
- Google API Suite: For Sheets and Maps integration.
Project 2: HDB Price Prediction
- Developed a machine learning model to predict Housing and Development Board (HDB) resale prices in Singapore.
- Features:
- Conducted extensive data cleaning, feature engineering, and exploratory data analysis (EDA).
- Implemented advanced regression models like XGBoost, LightGBM, and CatBoost for accurate predictions.
- Created a Streamlit app allowing users to input property details and get real-time price predictions.
- Tools & Technologies:
- Python: Utilized pandas, numpy, and scikit-learn for data preprocessing and modeling.
- Machine Learning Models: Evaluated and fine-tuned models using RMSE and R² metrics.
- Streamlit: Built and deployed a user-friendly application for price prediction.
Project 3: Christmas Gift Exchange
- Designed a festive app to simplify Christmas gift exchanges by automating the draw process.
- Features:
- Ensured fair gift allocation by preventing participants from being assigned to themselves.
- Provided an intuitive interface for adding, viewing, and managing participant lists.
- Included a real-time draw functionality to display gift pairings instantly.
- Added festive elements like autoplaying Christmas music for an engaging user experience.
- Tools & Technologies:
- Python: Implemented the logic for fair gift distribution using randomization.
- Streamlit: Built an interactive, web-based app for user-friendly interactions.
- HTML & CSS: Enhanced the app with embedded audio for a festive ambiance.
Project 4: Mapping EV Charging Stations
- Designed an interactive map showcasing electric vehicle (EV) charging Stations.
- Features:
- Extracted geocoordinates from CSV data for precise mapping.
- Visualized data with Folium, incorporating marker clusters for better interactivity.
- Created pop-ups displaying station names for an enhanced user experience.
- Tools & Technologies:
- Python: Processed CSV data and geocoordinates for visualization.
- Folium: Built an interactive map with FastMarkerCluster for efficient data representation.
Project 5: Scraping Nike Product Data
- Extracted and visualized product details from Nike's website for portfolio showcase.
- Features:
- Automated data extraction of product names, prices, and color options using Python.
- Implemented pagination handling and scrolling with Selenium to gather complete product data.
- Generated a structured dataset for potential business analysis or inventory management.
- Tools & Technologies:
- Python: Used BeautifulSoup and Selenium for web scraping and automation.
- Pandas: Processed and structured data into a CSV and Excel format for further analysis.
- Folium: Explored data visualization techniques for geographic representation of product availability.
Project 6: Visualizing Singapore Visitor Trends
- Developed an interactive Tableau dashboard to analyze and showcase Singapore's visitor statistics.
- Features:
- Explored trends in visitor demographics, arrival patterns, and top destinations.
- Created interactive filters for a user-friendly data exploration experience.
- Highlighted seasonal and regional variations in visitor data.
- Tools & Technologies:
- Tableau: Designed and published an interactive dashboard for visual insights.
- Data Cleaning: Processed raw visitor data to ensure accuracy in visualization.
Contact Me
Feel free to reach out via phone, email, or connect with me on social media!
Phone: +65 9733 1257
Email: weechai88@gmail.com